FALSE
[1] FALSEdata("faithful")
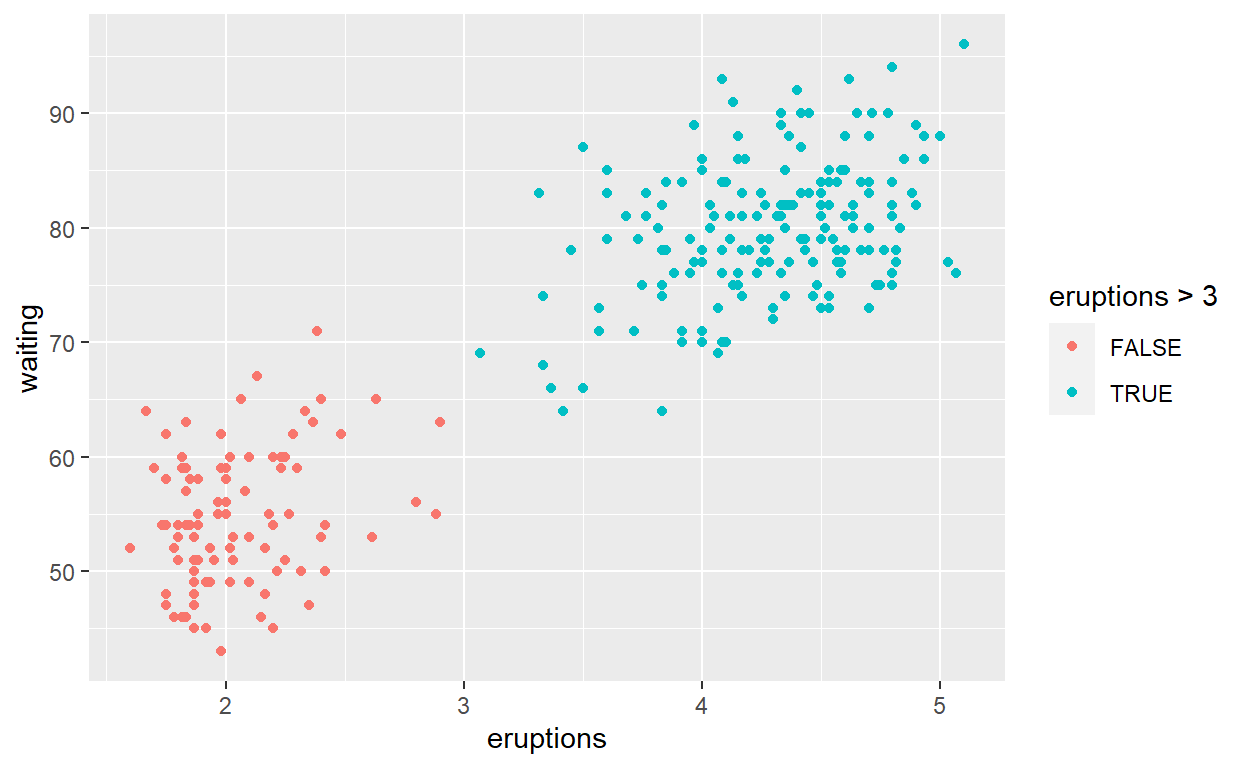
ggplot(faithful) +
geom_point(aes(x = eruptions, y = waiting,
colour = eruptions > 3))
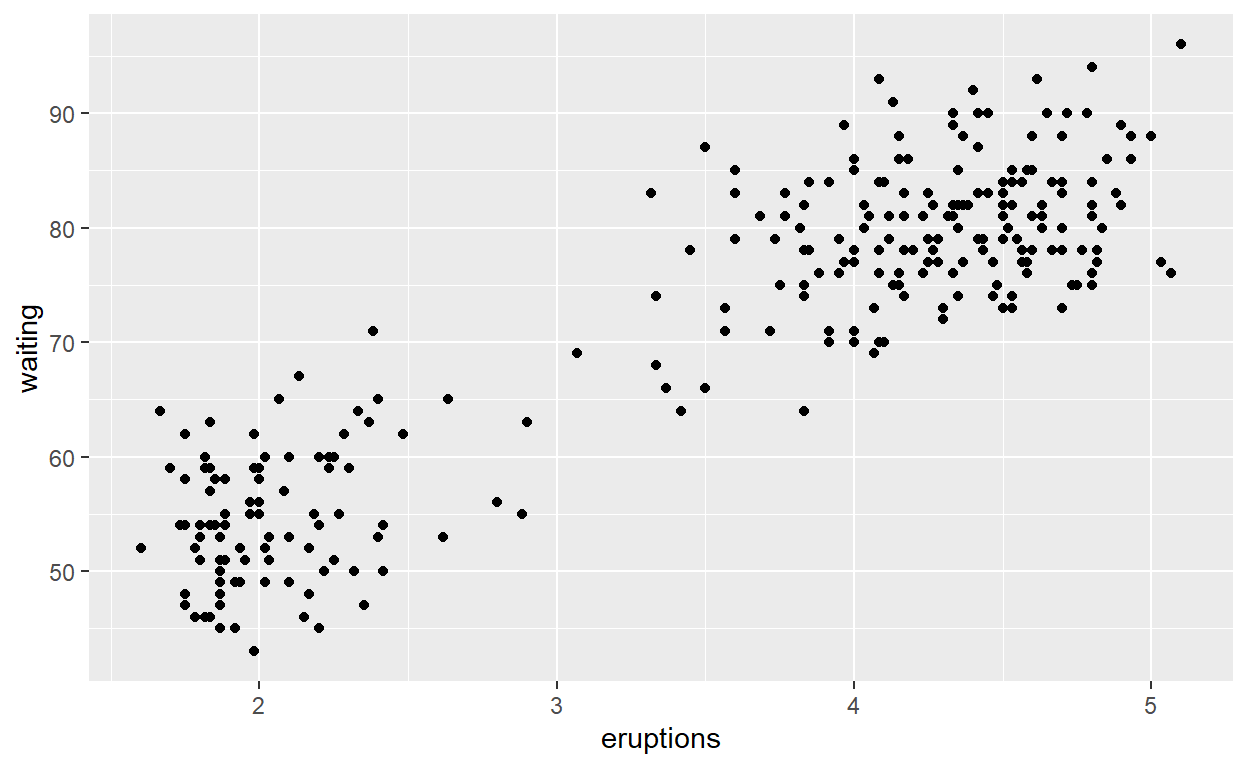
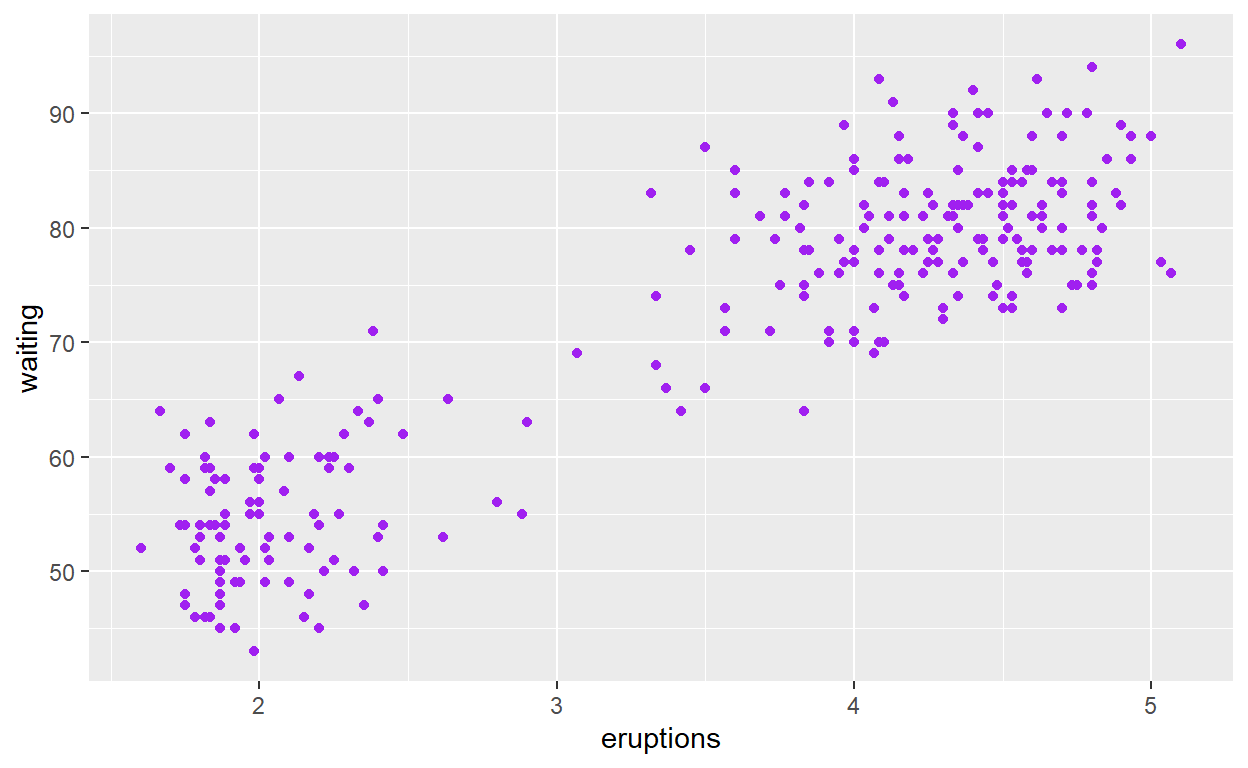
ggplot(faithful) +
   geom_point(aes(x = eruptions, y = waiting),
              colour = "purple")
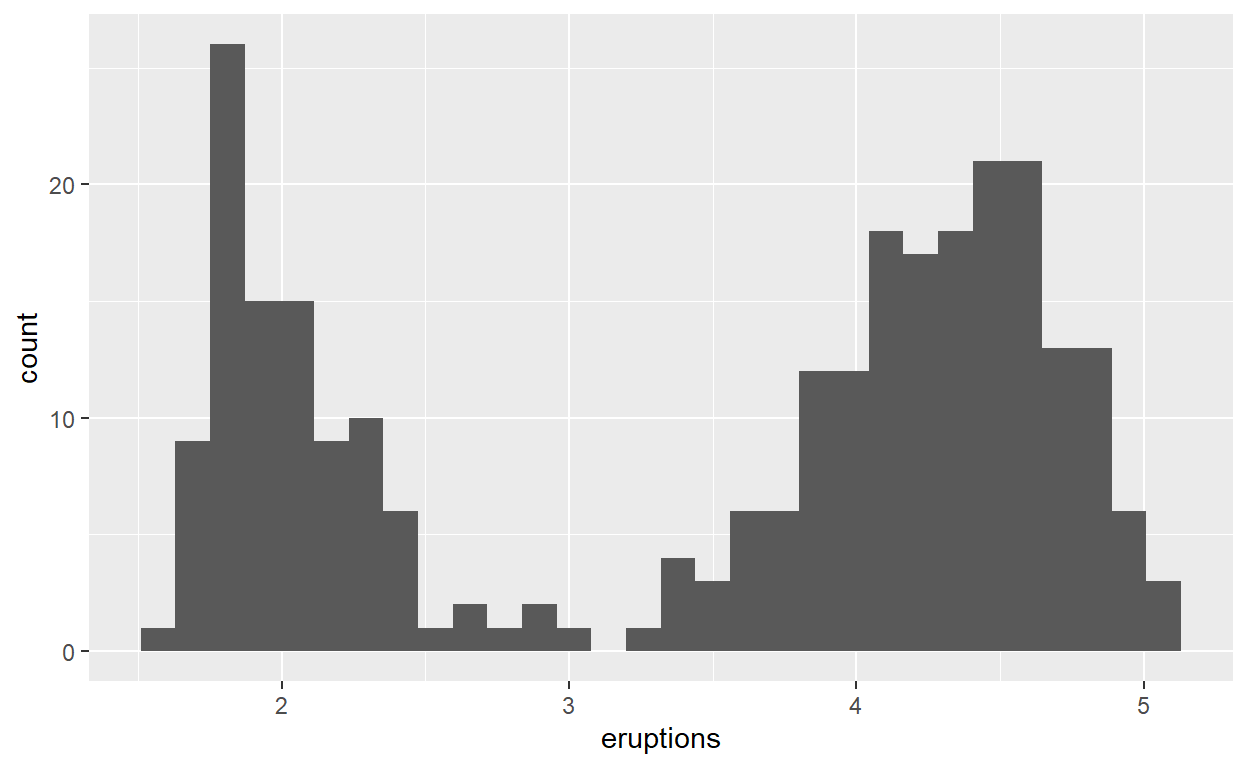
ggplot(faithful) +
   geom_histogram(aes(x = eruptions))
#questions: modify geom-ex-1
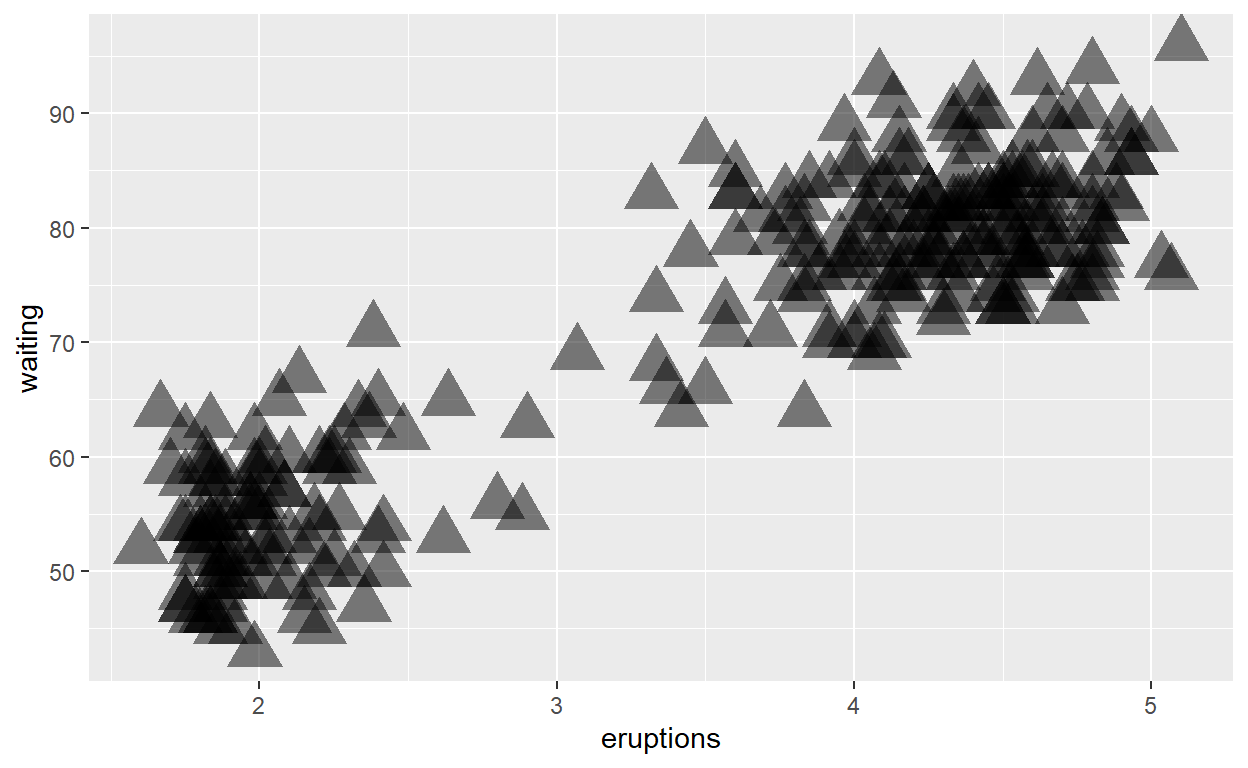
ggplot(faithful) +
   geom_point(aes(x = eruptions, y = waiting),
   shape = "triangle", size = 7, alpha =0.5)
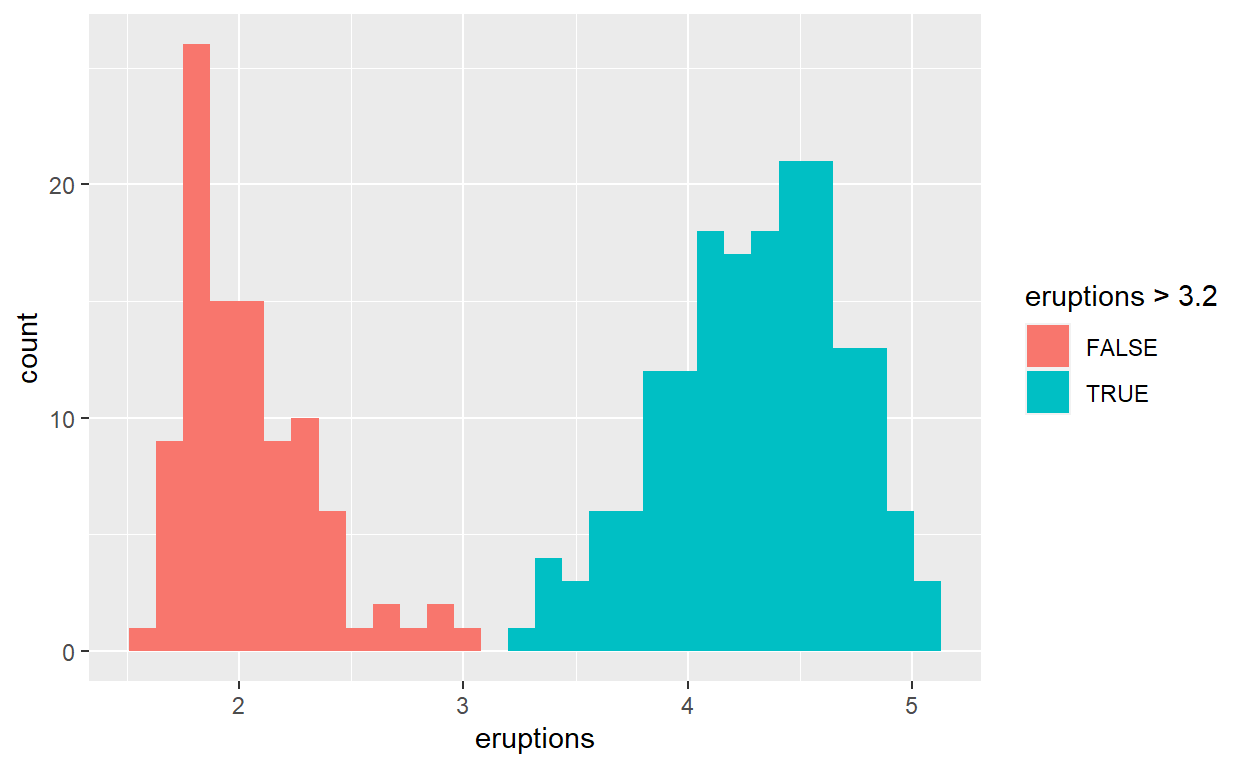
ggplot(faithful) +
   geom_histogram(aes(x = eruptions, fill = eruptions > 3.2 ))
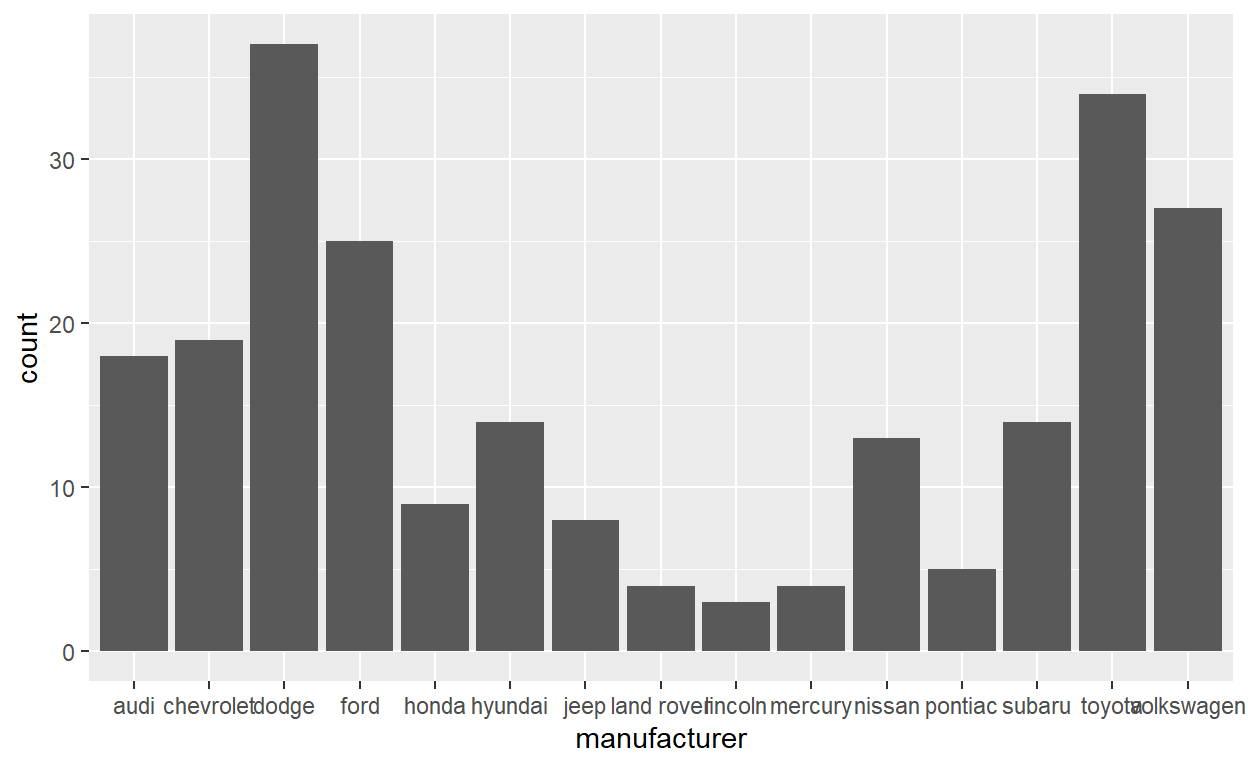
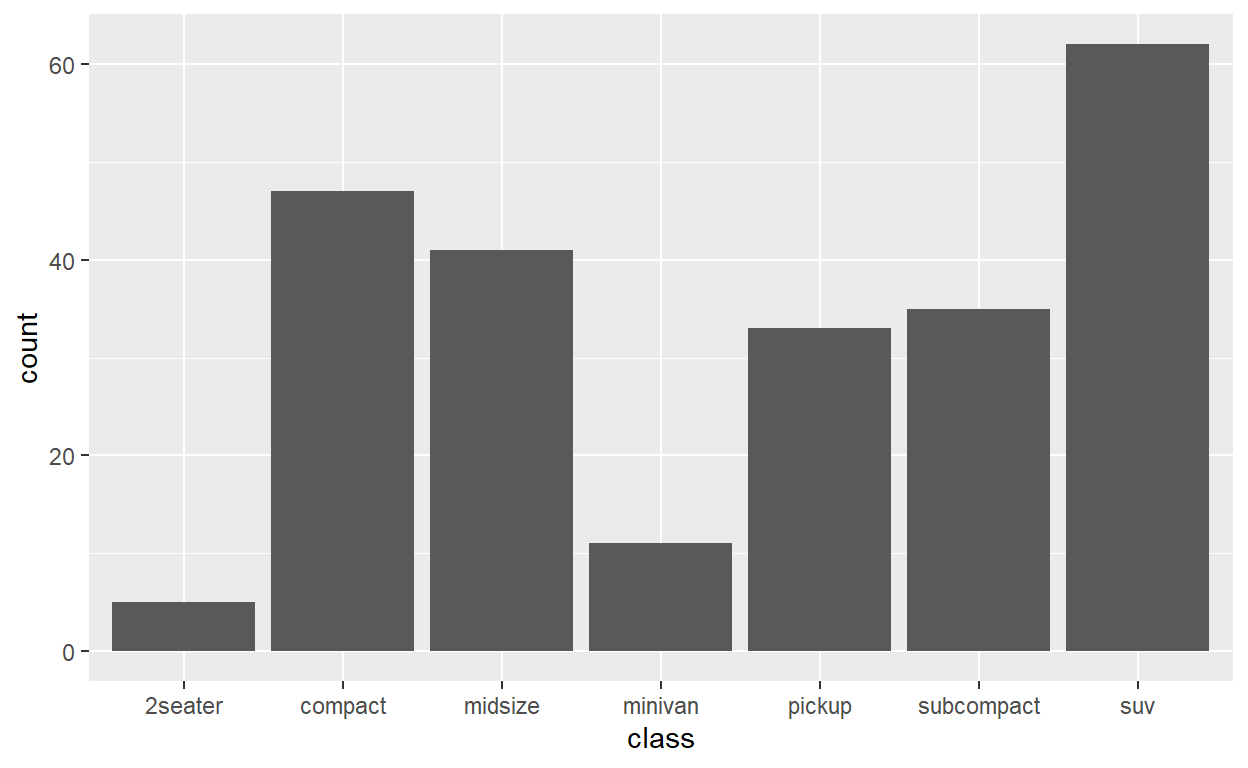
ggplot(mpg) +
   geom_bar(aes(x = manufacturer))
mpg_counted <- mpg %>%
  count(class, name = 'count')
ggplot(mpg_counted) +
  geom_bar(aes(x = class, y = count), stat = 'identity')
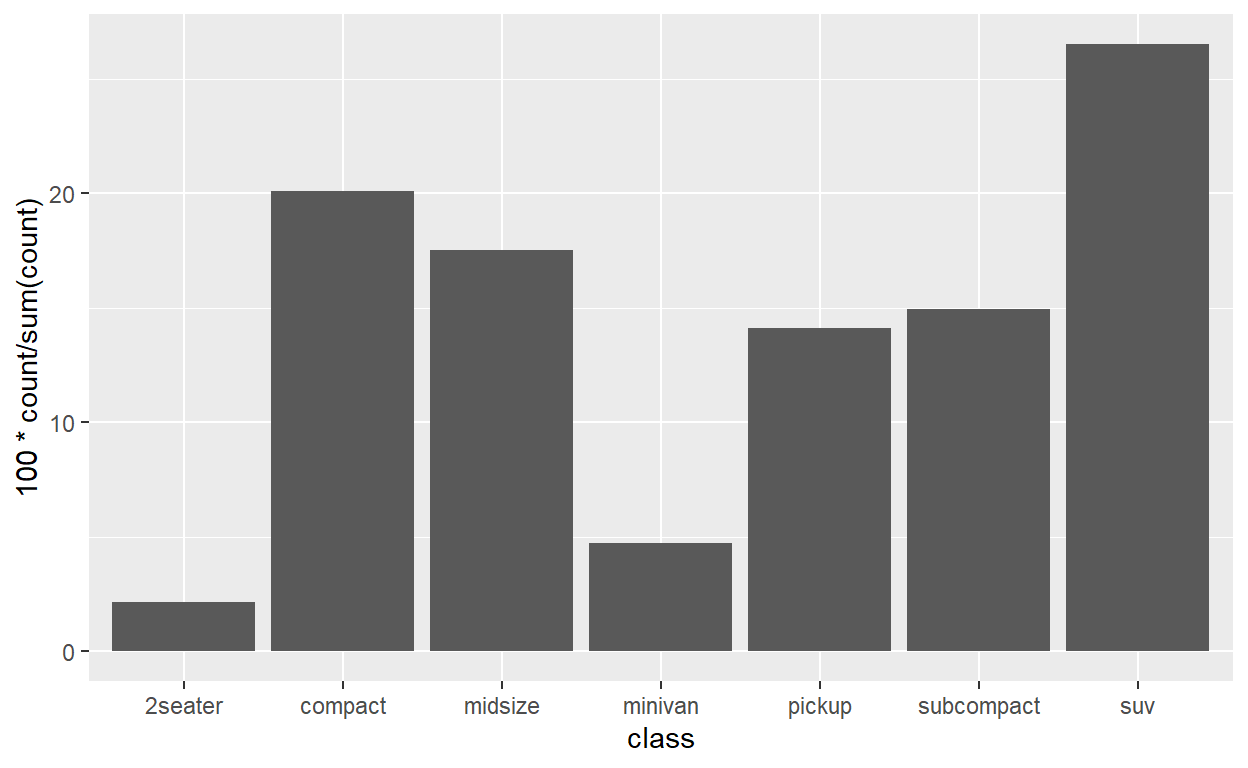
#modify stat slide -43
ggplot(mpg) +
  geom_bar(aes(x = class, y = after_stat(100 * count / sum(count))))
#question : modify answer to stat ex-2
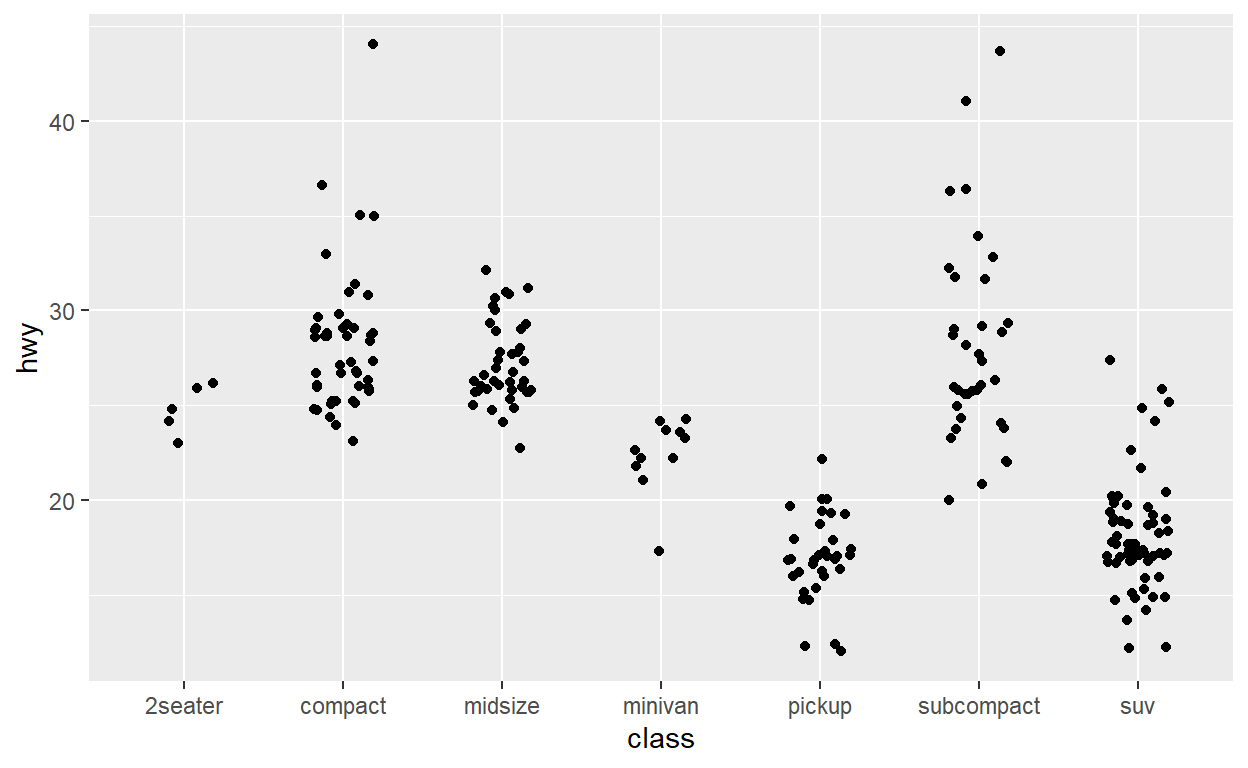
ggplot(mpg) +
  geom_jitter(aes(x = class, y = hwy), width = 0.2) +
  stat_summary(aes(x = class, y = hwy), geom = "point",
  fun = "???", color = "purple",
  shape = "square", size = 9 )